
Dash, an open-source Python framework, empowers developers to create interactive web applications with ease. In this article, we’ll explore Dash app example code to help you understand the basics and kickstart your journey into building your own interactive web apps using Python.
Contents
I. Introduction to Dash Apps
Dash is a Python framework developed by Plotly that allows you to create web applications with a focus on data visualization and interactivity. It’s particularly popular among data scientists, engineers, and developers for its simplicity and effectiveness.
1.1 Key Features of Dash
- Python-Centric: Dash is designed for Python developers, enabling you to build web apps using Python, your language of choice.
- Modular Components: Dash apps are constructed using reusable components, making it easy to create and maintain complex user interfaces.
- Interactive Visualizations: Dash seamlessly integrates with Plotly, which is known for its interactive charts and graphs.
- Real-Time Updates: Dash apps can provide real-time data updates and user interactivity, enhancing the user experience.
II. Dash App Web Applications Example Code
Let’s dive into some Dash app example code to illustrate the basics. We’ll start with a simple example and gradually build complexity.
2.1 A Simple Dash App
Below is a basic example of a Dash app that displays a single “Hello, Dash!” message.
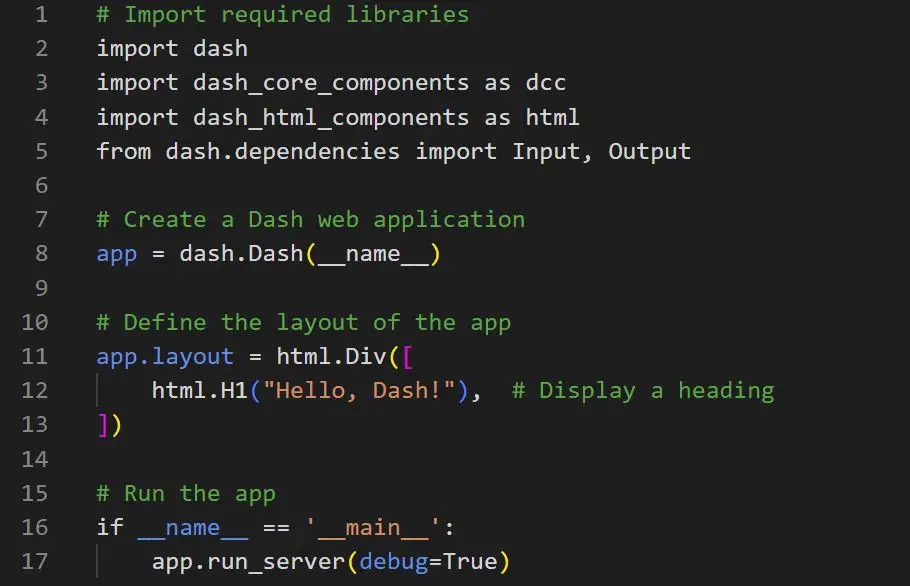
In this code:
- We import the necessary libraries, including Dash itself.
- We create a Dash web application using
dash.Dash(). - We define the layout of the app, which consists of an HTML heading displaying “Hello, Dash!”
- Finally, we run the app.
2.2 Adding User Interaction
Let’s enhance our Dash app with user interaction. In this example, we’ll create a simple input field where users can enter their name, and the app will greet them personally.
# Import required libraries
import dash
import dash_core_components as dcc
import dash_html_components as html
from dash.dependencies import Input, Output
# Create a Dash web application
app = dash.Dash(__name__)
# Define the layout of the app
app.layout = html.Div([
html.H1(“Personalized Greeting App”),
dcc.Input(id=’name-input’, type=’text’, placeholder=’Enter your name’),
html.Div(id=’greeting-output’)
])
# Define callback to update greeting
@app.callback(
Output(‘greeting-output’, ‘children’),
[Input(‘name-input’, ‘value’)]
)
def update_greeting(name):
if name:
return f’Hello, {name}!’
else:
return ‘Hello, Dash!’
# Run the app
if __name__ == ‘__main__’:
app.run_server(debug=True)
In this code:
- We’ve added an input field where users can enter their name.
- We define a callback function that updates the greeting message based on the name entered.
2.3 Integrating Data Visualization
Dash’s integration with Plotly allows us to incorporate interactive data visualizations. In this example, we’ll create a simple bar chart.
# Import required libraries
import dash
import dash_core_components as dcc
import dash_html_components as html
from dash.dependencies import Input, Output
import plotly.express as px
# Create a Dash web application
app = dash.Dash(__name__)
# Define the layout of the app
app.layout = html.Div([
html.H1(“Interactive Bar Chart”),
dcc.Graph(id=’bar-chart’)
])
# Define callback to update the bar chart
@app.callback(
Output(‘bar-chart’, ‘figure’),
[Input(‘bar-chart’, ‘relayoutData’)]
)
def update_bar_chart(relayout_data):
data = px.data.gapminder()
fig = px.bar(data, x=’year’, y=’gdpPercap’, color=’continent’)
return fig
# Run the app
if __name__ == ‘__main__’:
app.run_server(debug=True)
In this code:
- We import Plotly Express (
plotly.express as px) to create an interactive bar chart. - We add a graph component to the app layout and define a callback function that updates the bar chart based on user interactions.
III. Building Your Dash App
Now that you’ve seen some basic examples, here’s a simplified guide to building your Dash app:
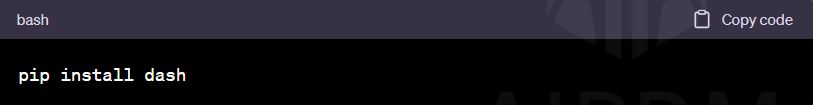
3.1 Installation
Start by installing Dash and any necessary dependencies using pip, the Python package manager:
3.2 Application Layout
Define the layout of your app using HTML components and Dash’s high-level components. This includes creating the structure of your app and arranging components.
3.3 Callbacks for Interactivity
Dash apps are interactive, thanks to callback functions. These functions specify how your app should respond to user input and update the content and visualizations.
3.4 Data Visualization
If your app involves data visualization, use Plotly or Plotly Express to create interactive charts, graphs, and maps that convey your data effectively. Customize the appearance and behavior of your visualizations as needed.
3.5 Deployment
Once your Dash application is ready, you can deploy it to the web. Common hosting options include platforms like Heroku, Amazon Web Services (AWS), DigitalOcean, and more. Deploying a Dash app often involves configuring a web server, setting up a domain, and ensuring data security.
3.6 Data Integration
Integrate your Dash application with data sources, databases, or external APIs as needed. Dash supports data connectivity, allowing you to fetch, update, and display real-time data.
3.7 User Authentication and Access Control
For applications that require user accounts or data access control, you can implement user authentication and authorization features using Dash and third-party libraries.
IV. Conclusion
Dash app example code demonstrates the versatility and accessibility of Dash for creating interactive web applications with Python. Whether you’re a data scientist, developer, or enthusiast, Dash provides a valuable tool for building data-driven, interactive interfaces.
As you explore Dash app examples on GitHub and other platforms, you’ll find a vibrant community of developers who leverage the power of Python to create engaging and interactive web applications. Dash empowers you to transform your ideas into reality and share them with the world. The possibilities are limitless, and the journey into the world of Dash is as exciting as the destination.
As Dash continues to evolve and gain popularity, it represents a significant advancement in democratizing web development and data visualization. With Dash, the power to create interactive, data-driven web applications is in your hands, making it a valuable asset in today’s data-centric world.
FAQs
1. What is Dash?
Dash is an open-source Python framework for creating interactive web applications, particularly used for data visualization and analysis.
2. Who is the intended audience for Dash applications?
Dash applications are primarily designed for data scientists, developers, and engineers looking to build web-based data visualization and analysis tools using Python.
3. How do Dash applications handle data visualization?
Dash applications often leverage the Plotly library, known for its interactive charts and graphs, to effectively visualize data.
4. Can Dash applications be deployed to the web?
Yes, Dash applications can be deployed to the web using various hosting platforms, allowing global accessibility.
5. What types of applications can be created with Dash?
Dash allows for the development of diverse applications, including data dashboards, machine learning model deployment apps, natural language processing tools, and geospatial mapping applications.
6. Is web development experience required to use Dash?
No, Dash is designed to be user-friendly for those without extensive web development experience, thanks to its Python-centric approach.
7. How can interactivity be added to Dash applications?
Interactivity in Dash applications is achieved through callback functions, which specify how the app responds to user input and updates content and visualizations.
8. Are there hosting options available for deploying Dash applications?
Yes, Dash applications can be deployed on various hosting platforms, including Heroku, Amazon Web Services (AWS), DigitalOcean, and more.
9. How can real-time data updates be integrated into Dash applications?
Dash applications can incorporate real-time data updates, enabling live data monitoring and interactive features for users.
10. What is the role of Dash in data-driven decision-making?
Dash is essential for data-driven decision-making, providing a platform to create interactive data visualization and analysis tools, helping users make informed decisions based on data insights.