Dash, a Python web framework, has gained significant popularity for creating interactive web applications, especially in the realm of data visualization and analysis. In this comprehensive guide, we will explore a Dash applications in Python to demonstrate how you can build your interactive data applications. We will cover the fundamental concepts, explore simple to more complex applications, and provide a step-by-step guide for building your Dash apps.
Contents
I. Introduction to Data Applications
It provides a simple and efficient way to create web applications with a strong focus on data interactivity. Dash’s core feature is its Python-centric approach, which makes it accessible to developers, data scientists, and engineers without extensive web development knowledge.
1.1 Key Features of Dash
- Python-Centric: Dash applications are written in Python, allowing developers to stay within their comfort zone.
- Modular Components: Dash apps are built using reusable components, simplifying the creation and maintenance of web interfaces.
- Interactive Visualizations: Dash effortlessly integrates with Plotly, enabling the development of interactive charts and graphs.
- Real-Time Updates: Dash apps can deliver real-time data updates and user interaction for an enhanced user experience.
II. Dash App Example in Python
Let’s delve into a simple Dash app example in Python to understand the fundamental concepts. We will start with a basic example and then progress to more complex applications.
2.1 A Basic Dash App
Here’s a straightforward Dash app example that displays a single message: “Hello, Dash!”
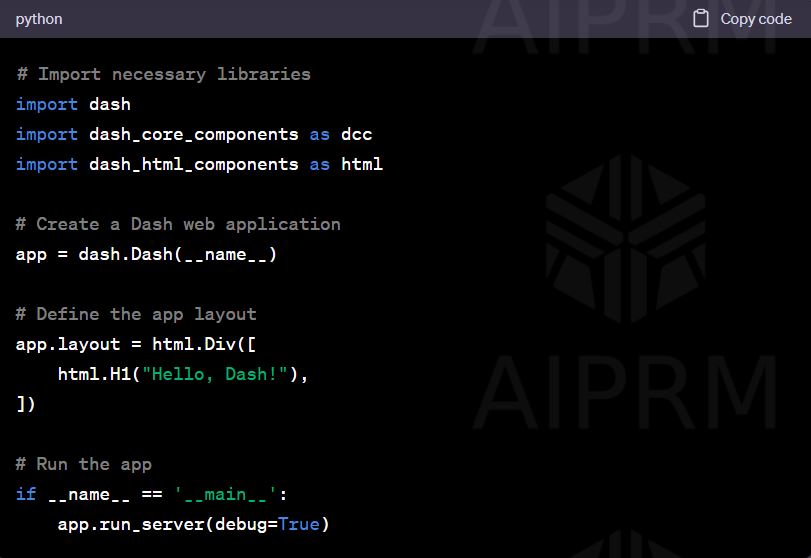
In this code:
- We import the required libraries, including Dash.
- We create a Dash web application instance.
- We define the app’s layout, which comprises an HTML heading displaying “Hello, Dash!”
- Finally, we run the app.
This is a simple introduction to a Dash application, serving as the foundation for more complex interactive applications.
2.2 Enhancing Interactivity
Let’s take our Dash app a step further by introducing user interaction. In this example, users can enter their names, and the app will greet them personally.
# Import necessary libraries
import dash
import dash_core_components as dcc
import dash_html_components as html
from dash.dependencies import Input, Output
# Create a Dash web application
app = dash.Dash(__name__)
# Define the app layout
app.layout = html.Div([
html.H1(“Personalized Greeting App”),
dcc.Input(id=’name-input’, type=’text’, placeholder=’Enter your name’),
html.Div(id=’greeting-output’)
])
# Define a callback to update the greeting
@app.callback(
Output(‘greeting-output’, ‘children’),
[Input(‘name-input’, ‘value’)]
)
def update_greeting(name):
if name:
return f’Hello, {name}!’
else:
return ‘Hello, Dash!’
# Run the app
if __name__ == ‘__main__’:
app.run_server(debug=True)
In this code:
- We’ve added an input field for users to enter their names.
- We define a callback function that updates the greeting message based on the user’s name input.
This example demonstrates how Dash enables you to add user interactivity to your applications effortlessly.
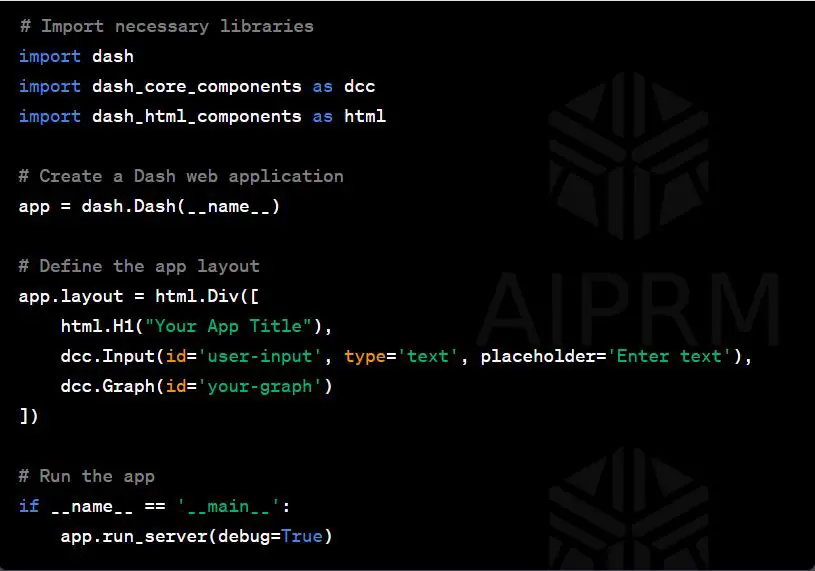
2.3 Incorporating Data Visualization
Dash’s integration with Plotly enables us to include interactive data visualizations in our applications. In this example, we create a simple bar chart.
# Import necessary libraries
import dash
import dash_core_components as dcc
import dash_html_components as html
from dash.dependencies import Input, Output
import plotly.express as px
# Create a Dash web application
app = dash.Dash(__name__)
# Define the app layout
app.layout = html.Div([
html.H1(“Interactive Bar Chart”),
dcc.Graph(id=’bar-chart’)
])
# Define a callback to update the bar chart
@app.callback(
Output(‘bar-chart’, ‘figure’),
[Input(‘bar-chart’, ‘relayoutData’)]
)
def update_bar_chart(relayout_data):
data = px.data.gapminder()
fig = px.bar(data, x=’year’, y=’gdpPercap’, color=’continent’)
return fig
# Run the app
if __name__ == ‘__main__’:
app.run_server(debug=True)
In this code:
- We import Plotly Express to create an interactive bar chart.
- We add a graph component to the app layout and define a callback function that updates the bar chart based on user interactions.
This example showcases how Dash empowers you to seamlessly incorporate data visualization into your web applications.
III. Building Your Dash App in Python
Now that you’ve seen some basic examples, let’s provide a comprehensive guide to building your Dash app:
3.1 Installation
Start by installing Dash and any necessary dependencies using pip, the Python package manager:
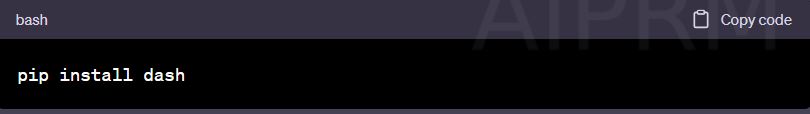
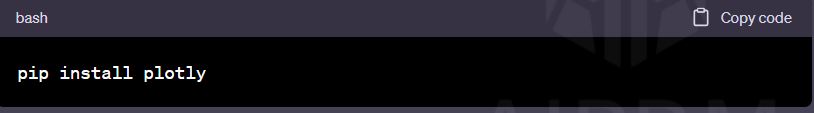
Dash is compatible with Python 3.6 and higher. Additionally, you can install Plotly for advanced data visualizations:
3.2 Application Layout
Define the layout of your app using HTML components and Dash’s high-level components. This includes creating the structure of your app and arranging components to achieve the desired user interface. Here are some of the core components:
html.Div: A container for grouping elements together.html.H1,html.H2,html.H3: Headings for your app.dcc.Input: An input field for user text input.dcc.Graph: A component for embedding data visualizations.And many more components to customize your app's layout.
3.3 Callbacks for Interactivity
Dash apps are interactive, thanks to callback functions, which specify how your app should respond to user input and update content and visualizations. Callbacks define the dependencies between components, allowing you to create dynamic applications.
In this example, we use a callback to update a text element based on user input:
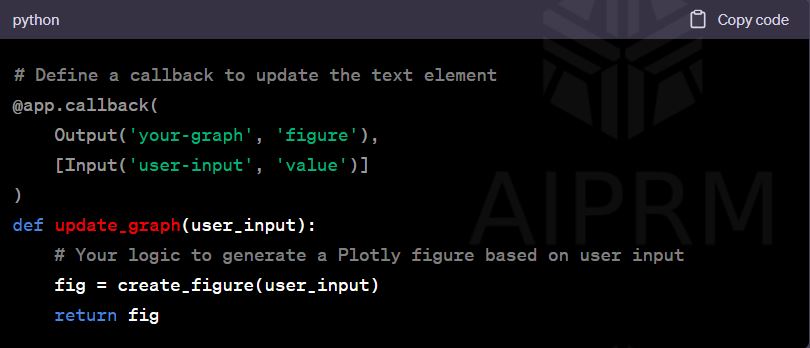
You can create more complex callback functions that handle user interactions, data processing, and dynamic updates.
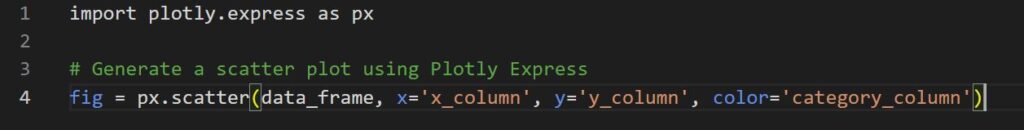
3.4 Data Visualization
If your app involves data visualization, use Plotly or Plotly Express to create interactive charts, graphs, and maps that effectively convey your data. Customize the appearance and behavior of your visualizations to suit your specific needs.
Here's an example of using Plotly Express to create a scatter plot:
3.5 Deployment
Once your Dash application is ready, you can deploy it to the web for public access. Here are some common hosting options for deploying Dash apps:
Amazon Web Services (AWS): AWS provides various hosting services for deploying web applications.DigitalOcean: A cloud infrastructure provider with straightforward hosting options.PythonAnywhere: A platform for hosting Python web applications.
The deployment process typically involves configuring a web server, setting up a domain (if necessary), and ensuring data security. Hosting platforms often provide step-by-step guides for deploying Dash apps.
3.6 Data Integration
Integrate your Dash application with data sources, databases, or external APIs as needed. Dash supports data connectivity, allowing you to fetch, update, and display real-time data. You can use Python libraries such as pandas to handle data, making it readily available for visualization and analysis in your app.
3.7 User Authentication and Access Control
For applications that require user accounts or data access control, you can implement user authentication and authorization features using Dash and third-party libraries. Authentication and access control mechanisms may vary depending on your hosting platform and specific requirements.
IV. Conclusion
In this guide, we explored a Dash app example in Python, providing a step-by-step journey from basic applications to more complex and interactive data-driven interfaces. Dash has emerged as a powerful tool for developers, data scientists, and engineers to create web applications that leverage Python's strength for data processing and analysis.
As you dive deeper into building Dash applications, you'll discover a vibrant community of developers who utilize the power of Python to create engaging and interactive web applications. Dash empowers you to turn your ideas into reality and share them with the world, whether you're building data dashboards, real-time monitoring tools, machine learning model deployment apps, or any other interactive web-based solution.
Dash's contribution to democratizing web development and data visualization is substantial. With Dash, the power to create interactive, data-driven web applications is within your grasp, making it a valuable asset in today's data-centric world. The possibilities are limitless, and the journey into the world of Dash is as exciting as the destination. So, start your Dash app development journey today and bring your interactive data applications to life!
FAQs
1. What is Dash?
Dash is an open-source Python framework for creating interactive web applications, particularly used for data visualization and analysis.
2. Who is the intended audience for Dash applications?
Dash applications are primarily designed for data scientists, developers, and engineers looking to build web-based data visualization and analysis tools using Python.
3. How do Dash applications handle data visualization?
Dash applications often leverage the Plotly library, known for its interactive charts and graphs, to effectively visualize data.
4. Can Dash applications be deployed to the web?
Yes, Dash applications can be deployed to the web using various hosting platforms, allowing global accessibility.
5. What types of applications can be created with Dash?
Dash allows for the development of diverse applications, including data dashboards, machine learning model deployment apps, natural language processing tools, and geospatial mapping applications.
6. Is web development experience required to use Dash?
No, Dash is designed to be user-friendly for those without extensive web development experience, thanks to its Python-centric approach.
7. How can interactivity be added to Dash applications?
Interactivity in Dash applications is achieved through callback functions, which specify how your app should respond to user input and update content and visualizations.
8. Are there hosting options available for deploying Dash applications?
Yes, Dash applications can be deployed on various hosting platforms, including Heroku, Amazon Web Services (AWS), DigitalOcean, and more.
9. How can real-time data updates be integrated into Dash applications?
Dash applications can incorporate real-time data updates, enabling live data monitoring and interactive features for users.
10. What is the role of Dash in data-driven decision-making?
Dash is essential for data-driven decision-making, providing a platform to create interactive data visualization and analysis tools, helping users make informed decisions based on data insights.